PUE and WUE
The indicators of data centres
Power Usage Efficiency (PUE)
The PUE represents the energy efficiency of a data centre, it represents the ratio between the energy consumed by the entire data centre (IT, cooling, security, lighting, etc ...) and the energy consumed to operate the servers.
PUE = Total electrical energy / IT electrical energy
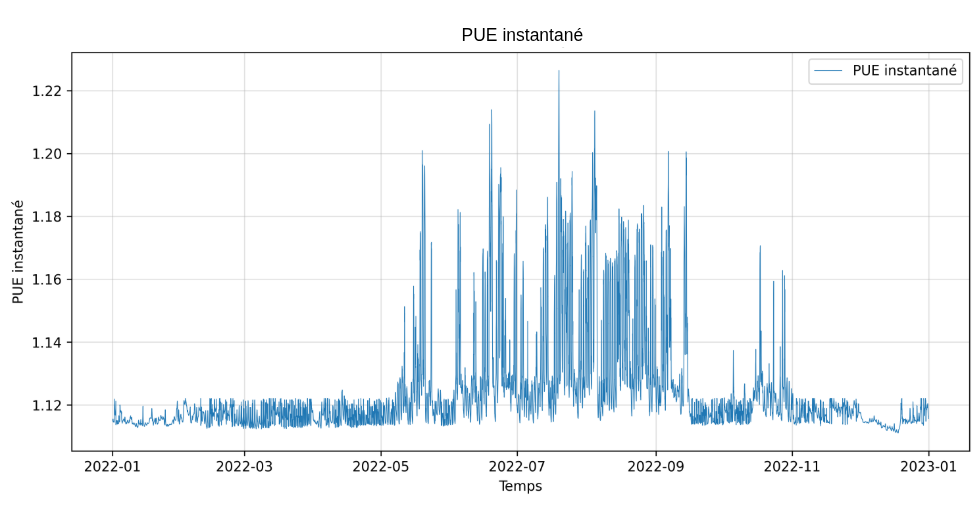
Note: The PUE can be seen as an integral quantity (comparing energy amounts) or instantaneous (comparing powers).
The closer the PUE is to 1, the more efficient the data centre is from an energy perspective. The average in France is 1.55 and 1.36 in Europe [1]. It is currently considered that a data centre with a PUE of less than 1.3 is a high-performing site. However, it should be noted that the PUE is not an economic indicator that takes into account electricity market prices or a carbon impact indicator that considers the source of electricity (nuclear, coal, solar, ...). It is simply an indicator of energy performance.
Some jurisdictions are beginning to emerge to compel data centres to operate more optimally. In China, the "Three-Year Action Plan on New Data Centers" sets as the goal a PUE < 1.3 for new data centres . Three different ratings of MEPS (Minimum Energy Performance Standard) are assigned to data centres ranging from a PUE < 1.2 (Grade 1) to a PUE < 1.5, (Grade 3). In Germany, new data centres must, since 1st July 2026, achieve a PUE < 1.2 and reuse 10% of their energy. Existing data centres must reduce their PUE to below 1.5 before 1st July 2027 and below 1.3 before 1st July 2030 [2].
One of the major challenges for data centre operators and designers is therefore to reduce the PUE as much as possible.
Cooling
The vast majority of the difference between the energy consumed by the data centre and the energy actually dedicated to the operation of the servers comes from the cooling of these servers. The main lever for reducing the PUE of data centres is therefore the consumption of cooling equipment. This includes the consumption of pumps circulating cold water, fans, or even the compressors of the cooling units.
There are two main ways to produce the cold needed for data centres:
- Air-cooled chillers
- Water-cooled chillers
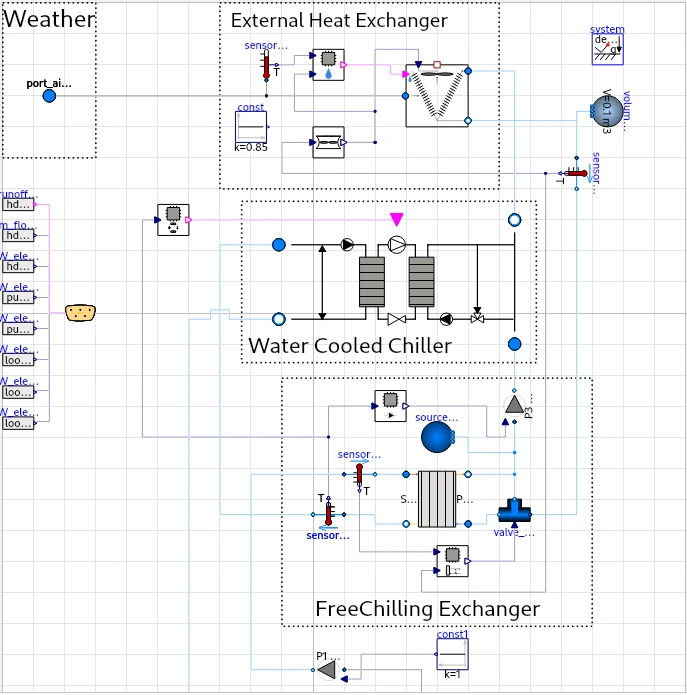
In the case of a water-cooled chiller, it is quite rare to pump water directly from a cold source (sea, river) and the most common architectures are those combining a water-cooled chiller with a rooftop air exchanger. These air exchangers can be of different types:
- Dry cooler
- Cooling tower
- Hybrid Dry Adiabatic Cooler (HDAC)
In order to minimise energy consumption associated with cooling production, some data centres integrate into their chilled water production modes of free chilling cooling (cf free chilling article)
Water Usage Efficiency (WUE)
Just as the PUE indicates the energy performance of a data centre, the WUE is an indicator of the water consumption of a data centre.Water consumption in a data centre can come from several sources (from the most significant to the least significant):
- Water evaporated by evaporative cooling technologies
- Water consumed during the production of osmosis water
- Water discharged after multiple evaporation cycles (too high salt concentration)
- Air humidification by Air Treatment Units (ATU)
- Sanitary uses on site
The counted water is only the water evaporated or returned to the sewers. Water taken from a river or the sea and then discharged warmed by a few degrees does not fall within the scope of the WUE.
The WUE is therefore calculated as follows:
WUE [l/kWh] = Volume of water consumed / IT Energy
Note: In the same way as for the PUE, an instantaneous WUE can be calculated by taking the ratio of the flow rate of water consumed to the IT power.
The average WUE in France is 0.25 and 0.58 in Europe. [1] but one must be cautious with averages as they include data centres not using evaporative means. The data centre operator EQUINIX clearly mentions this difference by indicating that on average its data centres have a WUE of 0.95 l/kWh but that the average of data centres using evaporative cooling is 1.55 l/kWh [3]. There is not yet any regulation imposing a limit on water consumption for data centres, but in light of the growing tensions on the issue of water stress, it cannot be ruled out that limitations may begin to appear.
Arbitration between WUE and PUE
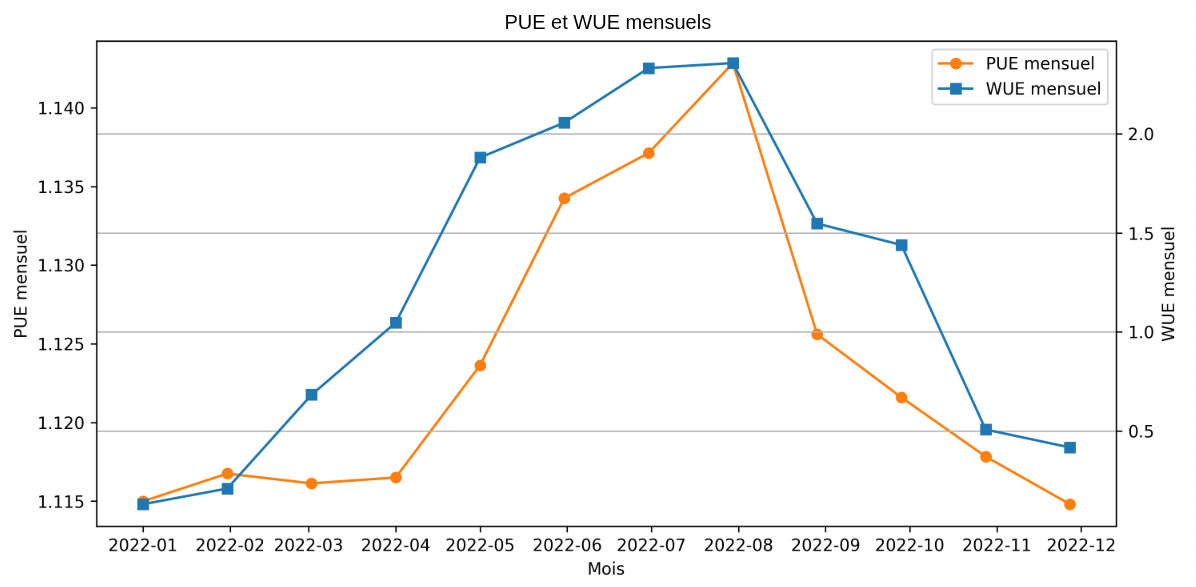
In view of what has been mentioned previously, it is clear that PUE and WUE are not independent indicators and that they are to be treated together. A data centre with a very low PUE due to having an evaporative cooling system may potentially have a greater environmental impact than a data centre consuming more electricity but no water. These arbitration questions between electrical and water consumption vary also throughout the seasons, with tensions on the water resource appearing more in summer in temperate regions. A data centre that is able to best adapt its water and electricity consumption to the available resources will be the one with the least environmental impact.