The problem
During a heatwave, the temperature in many apartments becomes difficult to bear, especially in homes with few openings. As soon as the outside air becomes cooler than the indoor air, a favorable period opens up: the goal is to evacuate the heat stored in the air and, more slowly, in the walls.
Methods and opinions differ for the next steps. Is it better to open wide and let natural convection take effect? Place a fan in front of the window to expel the hot air? Turn it around to let in fresh air? Or move it away so that its suction draws in a larger volume of air?
These actions seem intuitive, but estimating their effects is less obvious than it appears. A high speed in front of the window does not mean that the entire home is better ventilated. To differentiate these strategies, SIL3X has constructed a progressive case study, from a simple thermal model to a three-dimensional CFD simulation.
What phenomenon is responsible for the flow?
Temperature alters the density of air
At pressures close to atmospheric pressure, warm air is slightly less dense than cold air. Under the influence of gravity, it tends to rise while the cooler, denser air tends to sink. When the apartment is warmer than the outside, this difference creates a pressure imbalance at the height of the window and naturally sets the air in motion, even in the absence of wind. This mechanism is the origin of natural convection.
The opening serves as both an entry and an exit
Although the case study has only one opening, when the inside is warmer than the outside, the pressure profiles cross at a neutral height from the window. Below, the cool air enters; above, the warm air exits. Saying that "the lower half draws in and the upper half expels" is a good mental image, but the neutral height depends on the temperature difference, stratification, and pressure losses.
The incoming and outgoing flows can be significant while almost compensating each other in a steady state.
What the fan brings
A desk fan draws in the surrounding air beyond the disc of its blades. Its position and orientation therefore influence the overall circulation. If placed too close to the opening and poorly aligned, it can create a short circuit : the cool air enters, is immediately taken by the fan and expelled outside without having passed through the room.
An effective placement must promote circulation on a volume scale: the warm air from the distant areas is brought towards the window, while the incoming cool air reaches the occupied areas before exiting. Therefore, the local speed in front of the window is not sufficient to judge the effectiveness of the sweep.
A two-step approach
Modelica: order of magnitude
Before embarking on a CFD simulation, using a 0D/1D model allows for checking the orders of magnitude. The air in the apartment is represented by a perfectly mixed volume. The TAeZoSysPro library [1], co-developed by SIL3X and EDF R&D, is used. The exchange with the outside is modelled by an opening [2]. The walls are modelled by thermal capacities and resistances. In this model, no ventilation is present and there is no wind.

Figure 1 : View of the 0D model with the thermal capacity of air, walls and opening for exchange with the outside.
The energy balance of the air is written as:
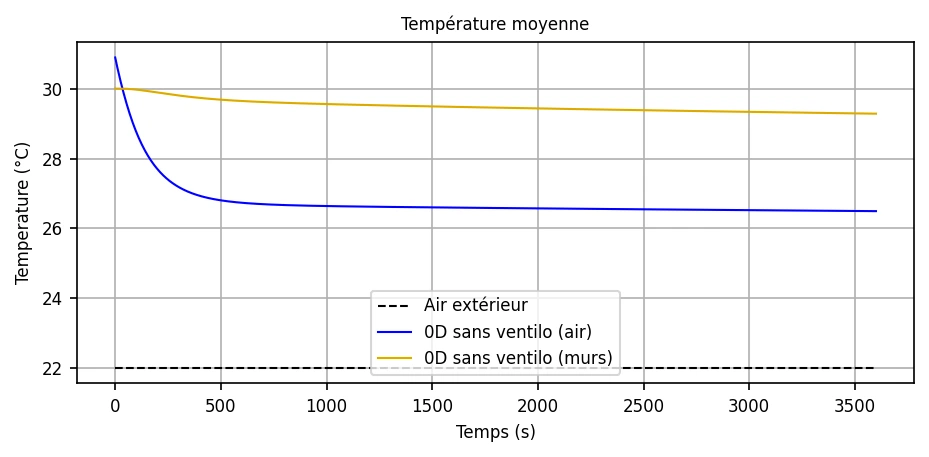
Figure 2 shows the evolution of temperatures over time, in blue the air temperature inside the room, in orange the temperature on the surface of the walls and in dashed lines, the imposed outside temperature. In the case of the 0D model, only an average temperature is evaluated on the room side, and not a local temperature. This amounts to considering the volume of the room perfectly mixed at all times, that is to say considering internal mixing in the room. Even with a significant flow rate, the walls, ceiling and floor continue to release the heat stored during the day. The characteristic time for air renewal is τair ≈ V/Q, but the actual inertia is greater as soon as the envelope is taken into account. The temperature on the surface of the walls decreases much less rapidly than the indoor air temperature. In reality, a human would perceive a felt temperature with a value between the average air temperature and the temperature of the walls that would exchange with the human body by radiation.
In order to best approach local phenomena, it is necessary to move to 3D.
Code_Saturne : three-dimensional flows
The second level is based on Code_Saturne 9.2 [3]. Unlike the 0D model, the CFD solves in each cell the conservation of mass, momentum and energy, simultaneously tracking temperature, velocity and flow through the window. This tool allows for taking into account changes in topology within the air volume as well as the heterogeneity of temperatures, velocities, pressure...
The apartment measures 8 × 3.5 × 3 m, which is 84 m³. It has a single window of 1.40 × 1.40 m on x = 0, as well as three interior walls, the detailed configuration is represented in Figure 3.


Figure 3: 3D geometry of the apartment and aerodynamic domain.
A meshed outdoor domain allows air to enter or exit freely. The potential temperature is initialized to 30 °C in the apartment and the solids, compared to 22 °C outside. All cases are monitored for 3,600 s. The parameters of the CFD models are detailed in Table 1.
Table 1: Numerical parameters of the CFD study.
| Parameter | Value |
|---|---|
| Turbulence | k–ω SST |
| Thermal / buoyancy | Dry atmosphere, potential temperature, gravity activated; compressible model deactivated |
| Time step | Variable ; environ 0,1 s dans les sorties fournies, avec |
| Aerodynamic roughness | None on the facade; z0 = 0.1 m in the weather profile and on the outdoor ground |
| External flow | Approximately 1 m/s tangentially to the façade |
Representation of the fan
The modelled fan is a Rowenta VU2730F0, with a diameter of 0.30 m and a manufacturer's free flow rate of 0.75 m³/s, which is 2,700 m³/h. Code_Saturne represents it as a cylindrical volume zone with a radius of 0.16 m, featuring blades with a radius of 0.145 m and a hub with a radius of 0.035 m.
The actual flow rate results from the operating point between this curve and the system pressure drop: the manufacturer's free flow rate is therefore not imposed in the room.

All tested cases direct the flow towards the window, thus towards the outside. The blowing, fan turned towards the inside, was not simulated: the study does not allow for classifying extraction and blowing.
The four compared cases
All cases share the same mesh, the same numerical settings and the same treatment of the external floor. Only the presence of the fan, its height and its distance from the window vary. The different configurations are detailed in Table 2.
Table 2: details of the different configurations retained as well as the averaged results.
| Case | Fan | Position (x ; y ; z) | Duration | Remark |
|---|---|---|---|---|
| Reference | No | 60 min | ||
| Low extraction | Yes | (1.0 ; 2.5 ; 1.75) m | 60 min | Close to window |
| High extraction | Yes | (1.0 ; 2.5 ; 2.45) m | 60 min | Close to window |
| Bottom extraction | Yes | (5.0 ; 2.5 ; 2.45) m | 60 min | Room bottom |
How to interpret the results?
The analysis relies on three families of complementary indicators:
- The average temperature of the indoor air volume, used to compare the overall cooling rate.
- The temperatures at the probes located at the bottom and top of the window, at the centre and top of the room are used to measure stratification and homogeneity.
- The velocity fields, glyphs and streamlines, observed from the inside and then from the outside, to determine if the jet actually crosses the opening or loops back near the façade.
Five point probes are placed at (0.5 ; 2.5 ; 1.5) m and (0.5 ; 2.5 ; 2.5) m near the window, (4.0 ; 1.75 ; 1.5) m at the centre, (4.0 ; 1.75 ; 2.7) m at the upper part and (−0.5 ; 2.5 ; 2.0) m outside.
Why the flow through the window is not represented
The integral of the incoming velocities on the plane of the window gives a gross flow of crossing. It counts each passage through this surface. If a packet of air exits, turns just in front of the facade and then re-enters, it is counted once at the exit and once at the entrance without having been evacuated to the distant external domain. The ratio of this flow raw to the volume of the room would then overestimate the actually useful air renewal.
Avec une seule ouverture et sans autre fuite modélisée, la conservation de la masse impose en outre un flux net presque nul à travers l’ensemble de la fenêtre en régime établi : toute sortie doit être compensée par une entrée sur une autre partie de l’ouverture. Les valeurs de débit et d’ACH sont donc écartées de la comparaison. Un traceur passif ou un calcul d’âge de l’air serait nécessaire pour mesurer un renouvellement effectif.
Results
Overall comparison
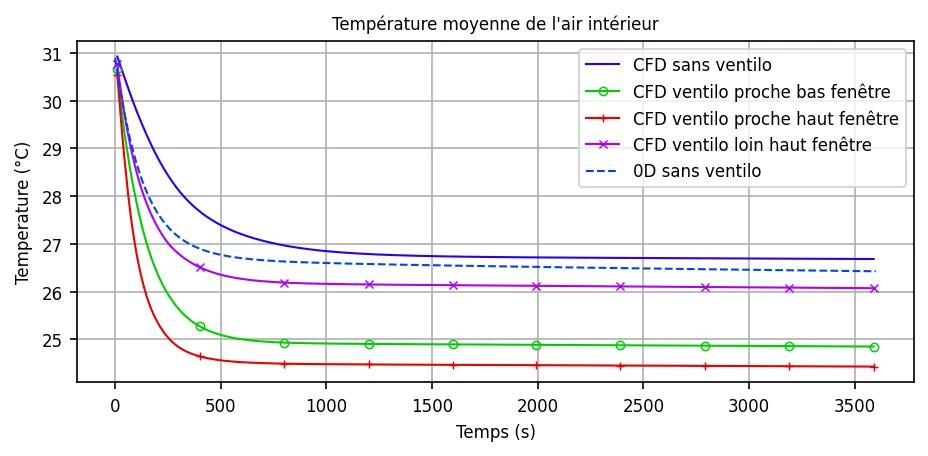
All cases present two phases: a rapid decrease during the first 10 minutes, followed by a slowdown mainly due to the heat released by the walls. After one hour, the average temperature is 26.7 °C without a fan, 24.8 °C with the low fan near the window, 24.4 °C with the high fan near the window and 26.1 °C with the high fan at the back of the room.
Reference case: window only
In the reference case, in the absence of a fan, it is possible to compare the average temperature in the volume to that obtained using the 0D approach. Figure 6 shows the evolution of the average temperature for the CFD model (dashed blue line) and the air temperature for the 0D model (solid blue line).
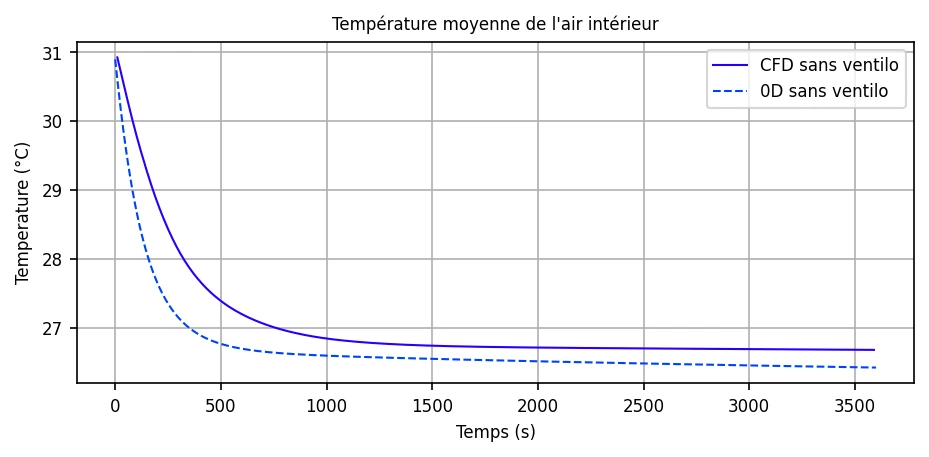
Figure 6 : Comparison of the temperature evolution between the 0D case and the CFD case in the absence of a fan.
The dynamics and the temperature difference between the two models are close despite a complex internal geometry that is difficult to capture in 0D. The air temperature is underestimated by the 0D model, which was expected as the 0D model assumes that the air is mixed at all times, whereas the CFD case shows a temperature heterogeneity, as reported in Table 3.
Table 3 : average temperature in the room and at the edges of the window at different times.
| Quantity | First reading | 15 min | 30 min | 60 min |
|---|---|---|---|---|
| Average air temperature | 30.93 °C at 10 s | 26.9 °C | 26.7 °C | 26.68 °C |
| temperature probe Bottom of window | 30.89 °C at 2 s | 26,5 °C | 26.46 °C | 26.42 °C |
| Temperature probe Top of room | 31.05 °C at 2 s | 28,0 °C | 27.55 °C | 27.50 °C |
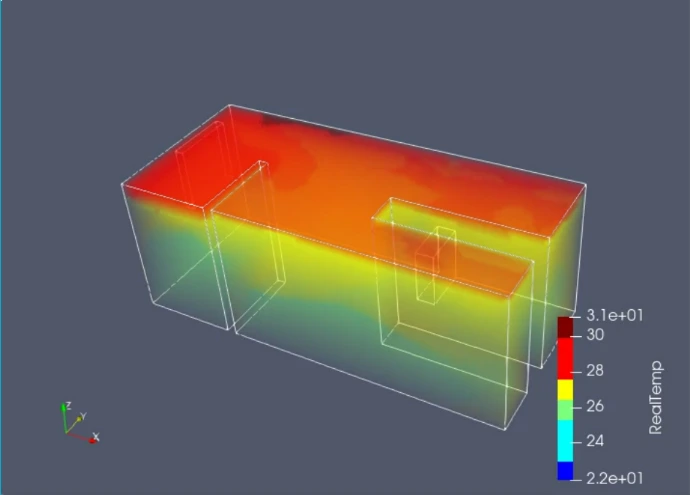
Figure 7 : temperature field in the absence of ventilation.
The opening alone creates a bidirectional exchange: cool air below and warm air above. The room remains stratified, with 1.1 °C between the top of the room and the bottom of the window at 30 minutes. At 60 minutes, the average air is still 4.1 °C above the outside air measured near the window: the nocturnal balance is not reached.
With fan: comparison of thermal performances
Table 4 : comparisons of the final state of the different CFD cases.
| Case | Duration | T at the first reading (10 s) | Final T | Decrease in the available readings | Final deviation from the reference |
|---|---|---|---|---|---|
| High fan near window | 60 min | 30,54°C | 24,4 °C | −6,1 °C | −2.26 °C |
| Low fan near window | 60 min | 30.66 °C | 24.85 °C | −5,8 °C | −1.8 °C |
| High fan at back of room | 60 min | 30,76°C | 26.07 °C | −4.69 °C | −0,6 °C |
| Reference without fan | 60 min | 30.93 °C | 26.68 °C | −4.25 °C | 0 °C |
The two positions near the window give the lowest final temperatures. The high position reaches 24.43 °C and the low position 24.85 °C, which are respectively 2.26 and 1.84 °C lower than the reference. The difference of 0.42 °C between these two placements remains modest considering the simplifications of the model. The fan placed at the back reaches 26.07 °C and only gains 0.61 °C compared to the case without a fan.
The following visualisation compares the three-dimensional evolution of temperature in the four configurations. The views use the same orientation and scale, ranging from 22 to 31 °C, in order to compare the progression of the fresh air, the persistence of the warm layer at the ceiling, and the level of homogenisation within the dwelling.
Without a fan, a marked stratification persists: the cooler air gradually occupies the lower part while a warm layer remains under the ceiling. Fans placed near the window accelerate the cooling of a large part of the volume and further reduce this warm layer. In contrast, the fan placed at the back of the room creates significant mixing, but maintains a generally higher temperature. The thermal comparison therefore mainly shows the quality of mixing and contact with the cool air; it does not prove, on its own, that an equivalent volume of indoor air has been expelled to the distant outside.
It is interesting to compare again the average temperature evaluated in 0D to the overall average temperature for the 4 CFD cases. Figure 8 shows the evolution of the air temperature for the 0D model (solid blue line) in relation to the average temperatures of the different CFD cases. The CFD case with the fan at the back of the room (red line) remains the closest to the 0D curve among the ventilated cases. In this 3D case, the indoor air of the room is stirred by the fan, without forming a jet that clearly propagates beyond the window. This results in a homogeneous temperature inside the room, which brings this case closer to the assumptions of the 0D case.
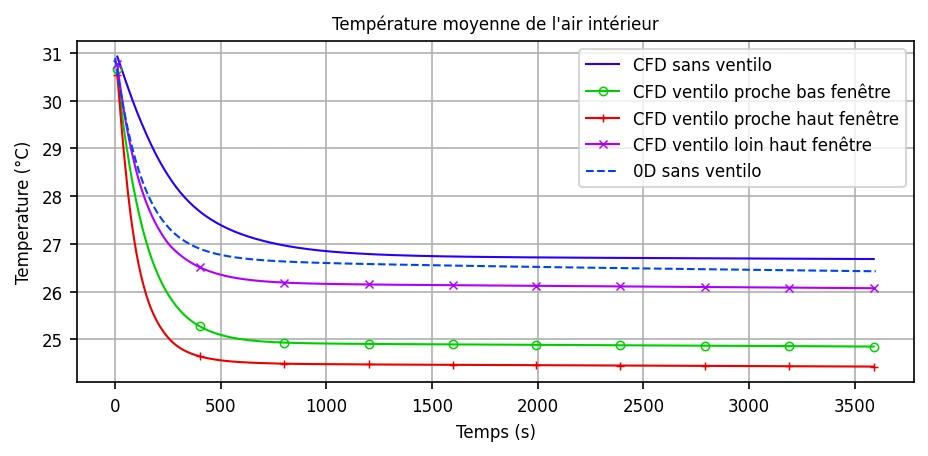
Figure 8: Comparison of the evolution of temperatures between the 0D case and the different CFD cases.
What the trajectories reveal at the window
The drop in temperature shows that cooler air is indeed reaching the room, but it does not indicate how far the air pushed towards the window is subsequently transported. The glyphs and streamlines are therefore observed at several scales, from the entire room to the immediate vicinity of the window. The four views are arranged in the same way: no fan in the top left, low fan near the window in the top right, high fan nearby in the bottom left, and high fan at the back in the bottom right.


Figure 10 : flows observed through the window, for different more or less close views.
Why does the jet not propagate clearly outside?
The fan is not installed in a sealed duct: it does not close either the window or the rest of the dwelling. Its jet occupies only part of the opening. As it approaches the facade, it expands into the external domain, entrains the surrounding air and quickly loses speed. It also encounters the flow present along the facade. The shear between these movements curves the trajectories and forms a recirculation zone in the immediate vicinity of the window. The different zoom levels show that, especially for the fan placed at the back, a large part of the jet does not continue its path towards the distant field: it folds back near the opening and can re-enter.
This reversal does not prevent all exchange. Cooler outside air enters through the areas of the window left free around the jet, while part of the indoor air reaches the opening. The actual operation is therefore simultaneously incoming and outgoing, and not that of a piston which would expel all the indoor air in a single pass. The conservation of mass precisely imposes this compensatory entry since no second opening or leak is modelled.
Close-up of the recirculation at the window in the case where the fan is placed at the back of the room

Figure 11 shows a view of the flow closest to the window, in the case where the fan is located several metres upstream. Here the glyphs represent the velocity vector, their size depends on the magnitude of the velocity and the colour represents the air temperature. The warm indoor air, visible in red, does reach the opening, but the trajectories curve sharply in its vicinity and a significant portion of the movement returns towards the room. At the same time, cooler air can enter around this area. The fan therefore sets the indoor air in motion towards the window without producing a jet that is permanently established in the external domain.
Recirculation near the fans
Loops appear in the vicinity of the volume zone representing the fan: a portion of the accelerated air returns to its intake zone due to the entrainment and pressure gradients. However, this local recirculation does not mean that the fan is running "in the void". The peripheral trajectories show that air continues to be drawn in, bypassing the fan zone or joining the main jet. The device thus stirs a larger volume, but only a fraction of this movement corresponds to a sustained transport outwards.
Probe temperatures at the end of calculation
Table 5: temperatures at the probes at the last available moment (3,598 s).
| Case | Duration | Bottom window | Top window | Centre | Top room | Range |
|---|---|---|---|---|---|---|
| Reference | 60 min | 26.4 °C | 27.4 °C | 26.6 °C | 27.5 °C | 1.1 °C |
| Low fan close | 60 min | 24.1 °C | 23.2 °C | 24.8 °C | 25.3 °C | 28.1 °C |
| High close fan | 60 min | 23.1 °C | 24.0 °C | 24.3 °C | 25.0 °C | 1.8 °C |
| Bottom room fan | 60 min | 25.9 °C | 26.2 °C | 25.9 °C | 26.2 °C | 0.3 °C |
The probes from the two configurations near the window range from 23.1 to 25.3 °C. The "back of the room" case is the most uniform, with only 0.3 °C of range, but its average temperature remains higher: homogeneity measures the mixing, not the efficiency of cooling.
Discussion
Methodology and approach SIL3X
At SIL3X, simulation is a means, not an end. Our approach always begins with understanding the problem: identifying the dominant physical phenomena, checking the orders of magnitude, and making relevant assumptions.
We then choose the appropriate level of modelling for the question. A 0D/1D model may be sufficient to understand a global dynamics, quickly test several hypotheses, or size a system. When phenomena become intrinsically spatial (stratification, recirculation, temperature or velocity heterogeneities), 3D CFD becomes the preferred tool.
The interest mainly lies in the complementarity of approaches. The simple model allows us to frame and challenge the detailed simulation; CFD, in turn, allows us to verify the assumptions, such as the assumption of homogeneous media, and to reveal local phenomena that cannot be represented in 0D.
This progressive approach allows us to mobilise the right tool at the right time, without unnecessarily complicating a study, while avoiding oversimplifying a problem to the point of obscuring important phenomena..
The case presented here illustrates this philosophy well: a seemingly simple question about the positioning of a fan involves buoyancy, stratification, recirculation, and interaction with the external flow. The value of the simulation therefore lies not only in the temperatures obtained but in its ability to explain the physical mechanisms that lead to these results and to specify their limits.
Air temperature is only part of comfort
A fan also enhances the feeling of coolness through convection on the skin, regardless of the average air temperature. This study focuses on housing cooling and air renewal, not on a complete model of thermal comfort.
The walls hinder night-time cooling
Over the simulated 45 to 60 minutes, the interior walls remain close to 30–31 °C, while the air reaches 25–27 °C. Air has a low thermal capacity in front of the envelope: a night-time ventilation must last several hours to also cool, at least partially, the walls.
The reference is not a case without wind at the facade.
The Code_Saturne weather module generates about 0.9 m/s along the facade. The case without a fan therefore combines buoyancy and external flow; it does not represent pure natural convection. Absolute flows and neutral height could differ in truly calm weather.
The fan model remains simplified
The volumetric zone and the curve Δp(Q) represent the average action of the fan, without detailed blade geometry. Only the extraction mode was tested. The number of meshes, mesh independence and comparable cuts of temperature and streamlines are not documented here. No passive tracer or air age has been calculated: the effective renewal is therefore not quantified. The values should be read as a comparison between four variants of the same model, and not as guaranteed universal performances.
Conclusion
In this simulated case, the window alone reduces the average temperature from 30.93 to 26.68 °C between the first available reading and the end of the simulated hour. The exchange combines buoyancy and external flow; it remains bidirectional, while the walls continue to release their heat.
The addition of a fan directed towards the window and placed about 1 m from the opening significantly improves the thermal result: the final temperature reaches 24.43 °C in the high position and 24.85 °C in the low position, which is 2.26 and 1.84 °C less than the reference. The difference of 0.42 °C between the two heights is not sufficient to establish a general rule.
The fan placed at the back cools less, with 26.07 °C at the end of the calculation, but homogenises the room more. The visualisations explain this contrast: the jet stirs the indoor air and reaches the window, but it folds back largely into the near outside instead of propagating towards the distant field. The raw flow crossing the plane of the window should therefore not be confused with an effective air renewal.
Practical recommendation for this configuration
As soon as the outside becomes cooler, open the window wide and place the fan facing outwards, at the height of the opening and about 1 m behind, leaving a free section around the jet for the compensatory intake of fresh air. Let it run as long as the outside air remains cooler. This recommendation is based on the thermal result of the simulated cases; it does not yet constitute a measure of effective air renewal.
To go further
- Compare supply to extraction, not tested here.
- Study other distances, for example 0.5 m and 2 m, and other window geometries.
- Document mesh independence and compare CFD cuts at identical scales.
- Confront the temperatures and effective renewal with tracer measurements in a real apartment.
References
[1] P. Borel, R. ulouel, F. Marsollier et A. Chupin, TAeZoSysPro: A Modelica Library for Thermal Aeraulic and Buildings Thermodynamics Calculations, DOI 10.3384/ecp218293.
[1] M. W. Liddament, Air Infiltration Calculation Techniques – An Application Guide , AIVC, Coventry, EMPA Dübendorf, Haustechnik (1989)
EDF R&D, Code_Saturne 9.2 — Documentation utilisateur, code-saturne.org.
Rowenta, Turbo Silence Extreme+ VU2730F0, Ø 30 cm, débit libre constructeur 45 m³/min.